'/%3e%3c/svg%3e)
'/%3e%3c/svg%3e)

Volatility Options Strategies: Trading Implied vs. Realized Volatility
Many option strategies bet on direction and profit if the price moves up or down by a specified amount, but what if you could bet on the size of the future price move being mispriced? Volatility strategies allow us to do this — rather than having a purely bearish or bullish opinion, they let you bet on a different view of the market through combinations of long and short calls and puts.
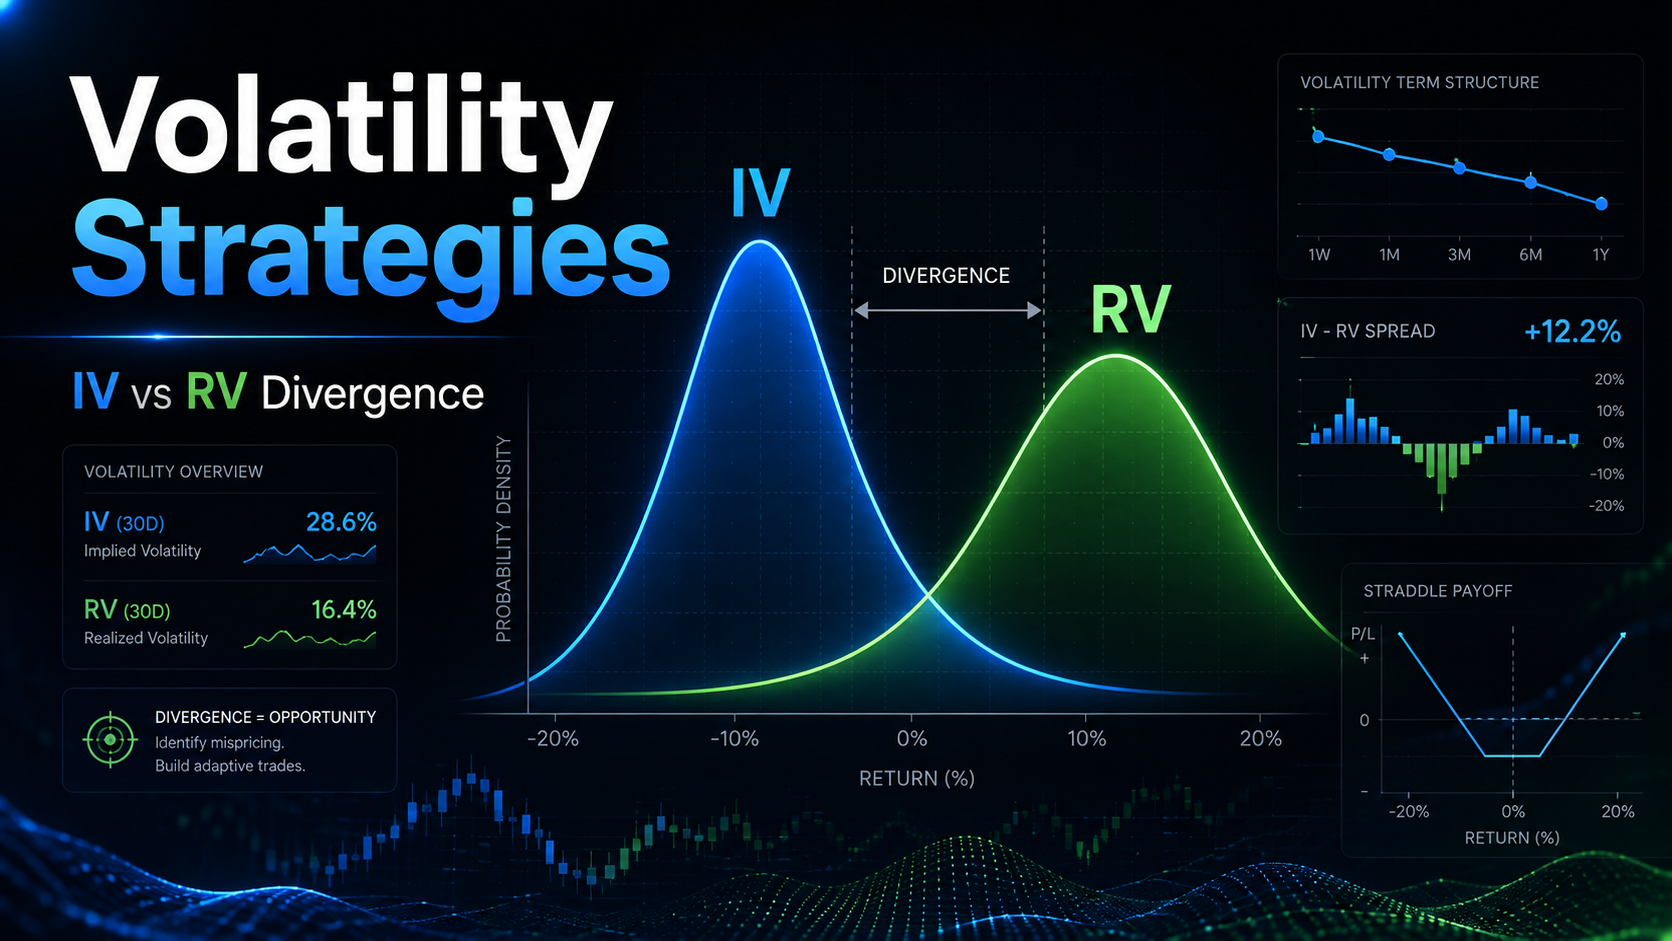
Instead of questioning, "Will the stock go up or down?", a volatility trader asks, "Will the stock move more or less than the market expects?"
What Are Volatility Options Strategies?
Volatility options strategies are options strategies that focus on the size of a stock's future price move rather than its direction. For directional options strategies, check out our related articles on Bullish options strategies and Bearish options strategies. These strategies compare implied volatility, which reflects the move the market expects, with realized volatility, which measures what actually happens. If a trader believes the market is underpricing movement, they may use long-volatility strategies. If they believe the market is overpricing movement, they may use short-volatility strategies.
Before understanding these strategies, two metrics you need to understand are IV and RV. IV (Implied Volatility) measures the expected size of the move. When IV rises, it means the market is expecting a large price move; when it contracts, it indicates the market's expectations of future price movement have decreased. In essence, IV is used to gauge market expectations for upcoming volatility.
The other metric, RV (Realized Volatility), measures how much the stock actually moved over a period of time. The key distinction is that IV is the expected move of the stock, and RV is the move that actually occurred.
| Strategy | Volatility View | Directional View | Max Loss | Primary Trade-Off |
|---|---|---|---|---|
| Long Straddle | Long (RV > IV) | Neutral | Total premium paid | Elevated entry IV can require a larger move to offset high premium |
| Long Strangle | Long (RV > IV) | Neutral | Total premium paid | Cheaper entry but requires a larger move to break even |
| Iron Butterfly | Short (RV < IV) | Neutral (near middle strike) | Spread width minus net credit | Narrow profit zone; stock must stay very close to middle strike |
| Iron Condor | Short (RV < IV) | Neutral (within a range) | Spread width minus net credit | Defined risk but lower premium than uncapped short strategies |
| Risk Reversal | Relative (put IV vs call IV) | Bullish or bearish | Substantial (short put exposure) | Not directional-neutral; sharp decline can cause large losses |
| Calendar Spread | Relative (short-term vs long-term IV) | Neutral short-term | Net debit paid | Profits require two favorable conditions to align |
Types of Volatility Strategies
Volatility strategies generally fall into three broad groups. — strategies that benefit when RV exceeds IV (the stock makes a larger-than-expected move), strategies that benefit when RV falls short of IV (the stock makes a less-than-expected move), and strategies that profit from relative discrepancies in IV between contracts (IV arbitrage). The third group, relative volatility strategies, compares option pricing across different parts of the options chain.
- Long Volatility Strategies: Profit when RV exceeds IV
- Long Straddle
- Long Strangle
- Short Volatility Strategies: Profit when RV falls short of IV
- Iron Butterfly
- Iron Condor
- Relative Volatility Strategies: Skew and Term Structure
- Risk Reversal
- Calendar Spread
Long Volatility Strategies: Profit when RV Exceeds IV
These strategies profit when the realized price reaction shoots over the market's expectations. For example, suppose you enter the trade when the option chain has priced in 10% annualized volatility, meaning it expects the stock to move approximately 0.6% every day. But later, the stock realizes closer to 25% annualized volatility, or about 1.6% daily. A long volatility strategy can profit because the actual price movement was greater than the volatility priced in by the market initially. This does not guarantee profit, since results still depend on timing, strike selection, IV change, and when the trade is closed.
In other words, the trader paid for options priced around 10% volatility, but the stock behaved closer to 25% volatility. That difference is what creates the opportunity for a long-volatility strategy to profit.
1) Long Straddle
The long straddle is the first of the strategies that profit from RV exceeding IV. It uses a combination of a call and a put with the same strike price and the same expiration date. Since both a call and a put are purchased when entering the trade, the trader pays two premiums upfront.
Before expiry, both legs may gain value if realized volatility is higher than implied volatility and the market reprices IV upwards. This is because the call and the put both benefit from an increase in expected movement, assuming the IV increase is large enough to offset theta decay.
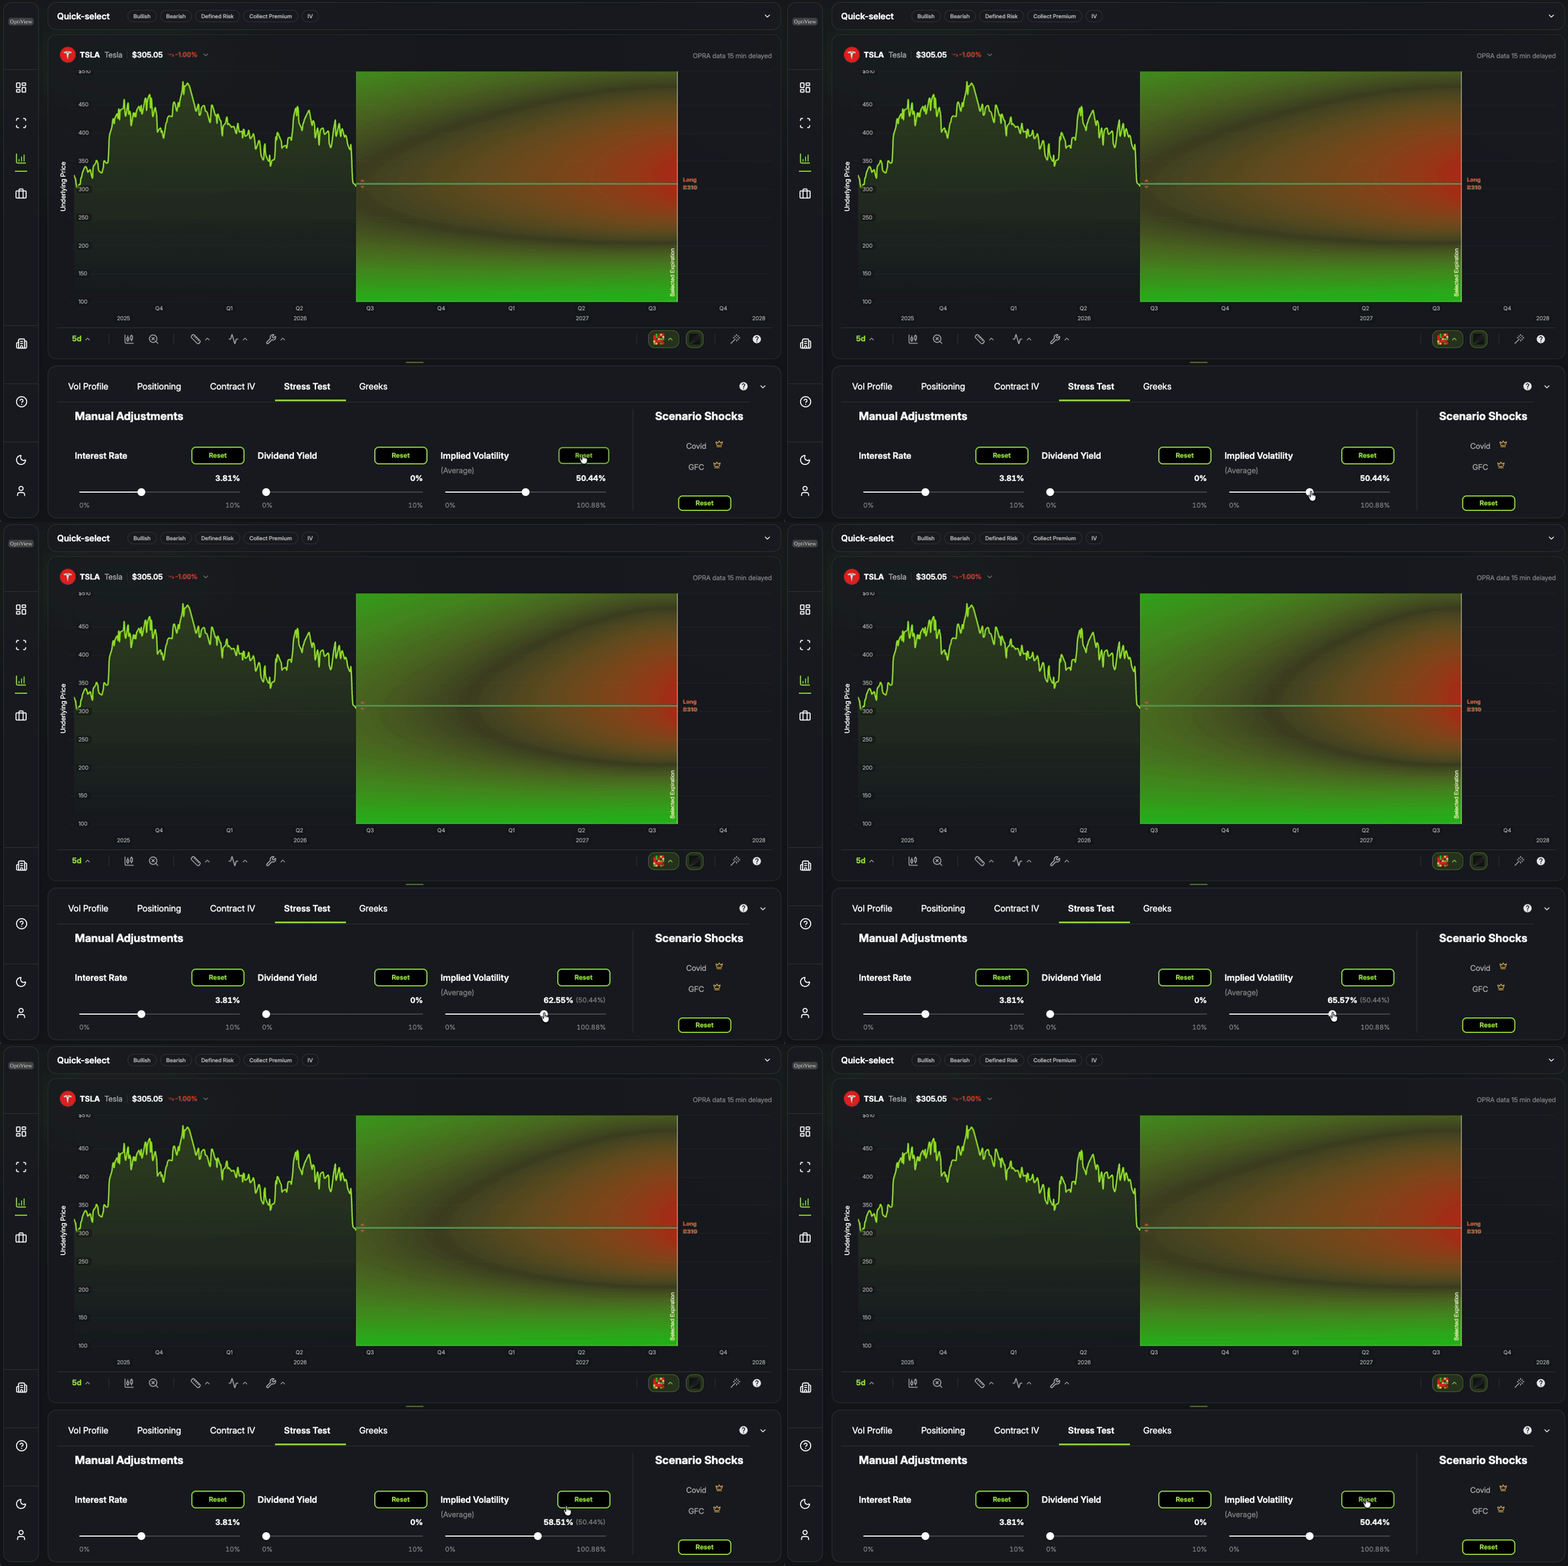
At expiration, only one side has intrinsic value — meaning one option can only become profitable while the other expires worthless. The winning option must gain enough value to cover the total cost of both options. The break-even price is the point where the gain from the winning option equals the total premium paid.
For example, with TSLA trading near $310 and a call premium of $15.50 and a put premium of $18.95: lower break-even = 310 − (18.95 + 15.50) = $275.55, upper break-even = 310 + (18.95 + 15.50) = $344.45. Total capital used: $3,445.
- Maximum Profit: Unlimited
- Maximum Loss: Total premium paid
- Best Outlook: Directionally-neutral (expect a large move in either direction)
- Ideal Environment: Implied movement is lower than your estimate of future realized movement
The ideal use case for the long straddle is when you believe the market is underpricing the potential impact of an upcoming event, and the actual move will be larger than the move implied by the option price. The maximum profit is theoretically unlimited, as the stock can rise indefinitely; the maximum loss is the total premium paid. The big downside of this strategy is that, with IV already elevated ahead of a major event, the premium paid for options also increases — the market has already priced the big move into the option price via IV. Once the event passes and uncertainty resolves, IV often comes crushing down. This widens the price move needed to break even, meaning the stock has to move significantly just for the trade to become profitable.
2) Long Strangle
A long strangle is a combination of buying two out-of-the-money options — a call option and a put option — preferably with a similar distance from the current stock price.
The long strangle is very similar to the long straddle and has the same use cases. Both strategies are used when you believe a major event's price move is underpriced. The main advantage is that it offers a lower upfront cost ($1,356 compared to $3,445 for the straddle). But the trade-off for the cheaper upfront cost is a wider break-even range — because the call and put strike prices are farther out-of-the-money compared to at-the-money in the straddle.
For example, with IBM near $235: buying a $260 call at $7.86 and a $210 put at $5.70 gives lower break-even = 210 − (7.86 + 5.7) = $196.44 and upper break-even = 260 + (7.86 + 5.7) = $273.56. Total capital used: $1,356.
- Maximum Profit: Unlimited
- Maximum Loss: Total premium paid
- Best Outlook: Directionally-neutral (expect a large move in either direction)
- Ideal Environment: Implied movement is lower than your estimate of future realized movement
The ideal use case is the same as the straddle, but it generally has a lower chance of profitability because the options are out-of-the-money and require a bigger price move. It is advised to run this strategy only when you believe there is significant underpricing of the potential impact of an upcoming event.
Short Volatility Strategies: Profit when RV Falls Short of IV
These strategies profit when the realized price reaction undershoots the market's expectations. For example, suppose you enter the trade when the option chain has priced in 40% annualized volatility, meaning it expects the stock to move approximately 2.5% every day. But later, the stock realizes closer to 20% annualized volatility, or about 1.3% daily. A short volatility strategy can profit because the actual price movement was less than the volatility priced in by the market initially. This does not guarantee profit, since results still depend on timing, strike selection, IV change, and when the trade is closed.
In other words, the trader sold options priced around 40% volatility, but the stock behaved closer to 20% volatility. That difference is what creates the opportunity for a short-volatility strategy to profit.
1) Iron Butterfly
The iron butterfly is composed of selling an at-the-money call and put while also buying a higher-strike call and a lower-strike put, all with the same expiration date. Selling the two inner options is what creates the profit opportunity; the two outer options cap the maximum loss. You give away a portion of your profits in exchange for having defined risk.
If at expiration the stock closes near the middle strike price, you get to keep the credit you received — the max profit is the net credit received when entering the trade. If at expiration the stock closes outside the outer options, one side of the spread reaches its maximum loss, with the net credit received partially offsetting that loss. For example, with a 30-point spread width and a net credit of $20.90, the max loss would be $9.10 per share.
- Maximum Profit: Net credit received
- Maximum Loss: Width of one spread minus net credit received
- Best Outlook: Market-neutral (expect the stock to stay near the middle strike)
- Ideal Environment: Implied movement is higher than your estimate of future realized movement, and the stock is expected to remain close to the middle strike
The ideal scenario is for the stock to finish near the middle strike at expiration. If the stock moves too far above or below that strike, the strategy loses value. Because of this, an iron butterfly is used when the trader believes the market is overpricing movement and the stock will remain close to a specific price.
2) Iron Condor
The iron condor is made up of a combination of a bull put spread and a bear call spread. A bull put spread is when you sell a higher-strike put and buy a lower-strike put with the same expiration date. A bear call spread is when you sell a lower-strike call and buy a higher-strike call with the same expiration date.
The iron condor is used when you speculate that the price of a stock is going to remain within a defined price range. It is similar to the short strangle, except the additional long options cap your potential losses. In exchange for this protection, you receive less premium, meaning your max profit is lower. The maximum profit is set when you enter the trade and is equal to the net credit received — but that profit is only kept if the options expire worthless or lose enough value before expiration.
For example, with PLTR near $170: Buy Put $145, Sell Put $155, Sell Call $185, Buy Call $200 — all expiring 03/19/27. Break-even prices: lower-end = 155 + (15.46 + 22.68 − 20 − 26.83) = $146.31, upper-end = 185 - (15.46 + 22.68 − 20 − 26.83) = $193.69. Net credit received: $869.
Maximum profit: net credit of $8.69 × 100 shares = $869 per contract. Maximum loss: largest spread width minus net credit = $15 − $8.69 = $6.31 × 100 shares = $631 per contract.
- Maximum Profit: Net credit received
- Maximum Loss: Width of one spread minus net credit received
- Best Outlook: Market-neutral (expect the stock to remain within a price range)
- Ideal Environment: Implied movement is higher than your estimate of future realized movement
The ideal case is when you speculate that the stock is going to move sideways within a range and IV decreases. Traders who want to profit from stable prices while keeping their maximum risk defined often choose an iron condor over a short strangle.
Relative Volatility Strategies: Skew and Term Structure
A relative volatility strategy compares option pricing across different parts of the options chain. These differ from IV mispricing strategies because they measure whether one option is expensive or cheap relative to another, rather than comparing implied volatility to expected realized volatility.
1) Risk Reversal
A risk reversal strategy isn't commonly associated with being a volatility strategy, but when used in the context of high volatility skew, it becomes a relative volatility strategy. High volatility skew is when there is a gap between the IV percentages of call-side options and put-side options; as this gap varies between each stock, it can produce a bullish or bearish risk reversal.
You can take advantage of this gap by selling the higher-IV side and buying the lower-IV side. Keep in mind that IV is embedded directly into the price of an option, so a higher IV generally means a more expensive option within the same market conditions.
In cases where put IV is much higher than call IV, it means traders are paying more for downside protection. This is common in equity markets — investors often fear sharp downside moves more than sharp upside moves. In this case, puts are expensive relative to calls, which creates an opportunity to sell the expensive puts and buy the cheaper calls, creating a bullish risk reversal. This would be a bullish options strategy, but the imbalance in IV between the calls and puts influencing the position makes it a relative volatility strategy.
You buy an out-of-the-money call option and simultaneously sell an out-of-the-money put option with a similar distance from the current price. The premium from the short put offsets — or sometimes completely covers — the premium paid for the long call. The strategy does not need to generate a net credit to qualify as a risk reversal; the important point is that the trader is using the relative pricing difference between puts and calls.
Ultimately, this creates synthetic, stock-like directional exposure and can be used to increase leverage or to gain exposure to companies whose stock price is out of reach for small accounts.
If the stock rises above the call strike price, the call starts gaining value and the put expires worthless — the preferred scenario. If the stock falls below the put's strike, the put starts losing money and the call expires worthless. If the stock stays between the call and put strike prices, you keep any net credit received.
- Maximum Profit: Large upside potential
- Maximum Loss: Substantial due to the short put
- Best Outlook: Bullish, with a view that put IV is expensive relative to call IV
- Ideal Environment: Put IV is high relative to call IV, allowing the trader to sell expensive downside volatility and buy cheaper upside exposure
Unlike the strategies covered earlier, this strategy is not directional-neutral, and a sharp decline in the stock can lead to substantial losses. The main advantage is that the strategy gives upside exposure at a lower net cost than simply buying the call outright, because the short put premium helps finance the long call.
The strategy can also be turned into a bearish strategy: instead of selling expensive puts to finance the calls, you sell the expensive calls to finance the puts, creating a bearish risk reversal. To identify volatility skew, you can use the Volatility Skew filter metric in the OptiScan scanner. In OptiScan, volatility skew is calculated as the IV of the 25-delta put minus the IV of the 25-delta call for the front-month expiry, so a positive value indicates that risk reversals are relatively cheap. A high positive volatility skew lets you filter for expensive puts, and a near-zero or negative volatility skew lets you filter for expensive calls. This strategy is not advised for beginners, as selling options can lead to substantial losses.
 for options contracts on underlyings with a low volatility skew to identify potential options that are attractive for trading a risk reversal options strategy.](https://opti-view.com/assets/img/blog/volStratsRiskReversal.gif)
Also check out the article on four simple OptiScan filters for better option trade opportunities.
2) Calendar Spread
A calendar spread is another relative strategy not usually mentioned in volatility discussions. It is included here because a calendar spread makes money through the difference in IV pricing between a short-term option and a longer-term option, using volatility to its advantage.
Traders execute this by selling a short-term call or put and buying a longer-term call or put at the same strike price. It is important to buy and sell the same type of option. A call calendar spread is created by selling a short-term call and buying a longer-term call at the same strike price. A put calendar spread is created by selling a short-term put and buying a longer-term put at the same strike price.
Calendar spreads are also often used because short-term options lose value faster than long-term options due to time decay (theta). Since longer-term options usually contain more time value, they are priced more expensively, and selling the short-term option helps offset the cost of the long-term option.
- Maximum Profit: Not fixed; usually highest when the stock stays near the strike at the short option's expiration
- Maximum Loss: Net debit paid
- Best Outlook: Short-term range-bound near the strike, then potentially directional after the short option expires
- Ideal Environment: Short-term option is expensive relative to the longer-term option, and the stock is expected to stay near the strike in the short term
The ideal scenario for a call calendar spread is if the stock stays near the chosen strike price before the short-term call's expiry and then rises before the long-term call's expiry — allowing the short-term call to expire worthless and the long-term call to gain value. The ideal scenario for a put calendar spread is the inverse: the stock stays near the strike before the short-term put expires, then falls before the long-term put expires.
Decision Framework: Choosing a Volatility Strategy
After understanding the individual strategies, the next step is knowing when each one may fit a specific market outlook. The goal is not to memorize every structure, but to match the strategy to your view on implied volatility, realized volatility, direction, and risk.
The key question to ask is: Do I believe the stock will move more or less than the options market expects?
If you believe the stock will move more than the options market expects, long volatility strategies are more suitable. These strategies benefit when RV exceeds IV. If you want unlimited upside and are willing to pay a premium, the long straddle is suitable. If you want a cheaper entry and are comfortable needing a larger move to break even, a long strangle may be preferred. If you still expect a significant move but want a cheaper defined-risk structure with capped profit, a reverse iron condor may be considered.
If you believe the stock will move less than the market has priced in, short-volatility strategies are usually more suitable. These strategies benefit when realized movement is smaller than implied movement. If you want to collect the highest premium and accept substantial risk, a short straddle may be used. If you want defined risk while still benefiting from the stock staying within a range, an iron condor may be more appropriate.
Some strategies are not mainly about whether realized movement beats implied movement — instead, they focus on relative pricing. If you believe puts are expensive relative to calls, a bullish risk reversal may allow you to sell expensive downside volatility and buy cheaper upside exposure. If you see an opportunity between short-term and longer-term option pricing, a calendar spread may be useful.
| Your Outlook | Strategy to Consider |
|---|---|
| Expect large move in either direction (RV > IV), want unlimited upside | Long Straddle |
| Expect large move in either direction (RV > IV), want cheaper entry | Long Strangle |
| Expect stock to stay near a specific strike (RV < IV), want max premium | Iron Butterfly |
| Expect stock to stay within a range (RV < IV), want defined risk | Iron Condor |
| Puts expensive relative to calls, bullish outlook | Bullish Risk Reversal |
| Calls expensive relative to puts, bearish outlook | Bearish Risk Reversal |
| Short-term options expensive relative to longer-term options | Calendar Spread |
The final choice still depends on the trader's risk tolerance, margin requirements, time horizon, and how much movement is already priced into the options.
Conclusion
There is no single best strategy — every strategy has its own pros and cons and ultimately depends on your trading style and market outlook. The key to success with volatility strategies is understanding market expectations and the relationship between IV, RV, and the options price. Before entering a trade, always identify your maximum potential profit, maximum potential loss, break-even prices, and the market outlook.
Tip: Every trader experiences losses, but successful traders manage risk so that their winning positions outweigh their losing ones over time. This is why risk management is one of the most important parts of trading options or any other financial instrument.
To easily use these strategies in your trading journey, you can use the Strategy Assistant, powered by OptiStrat, which automates this process for you. Simply enter your belief for the underlying stock price, investment horizon, and optionally constraints and objectives, and OptiStrat compares thousands of possible combinations — including the long straddle, long strangle, reverse iron condor, short straddle, iron condor, and all the other strategies discussed here, along with many more advanced structures.