

The leading platform for options analytics and trading
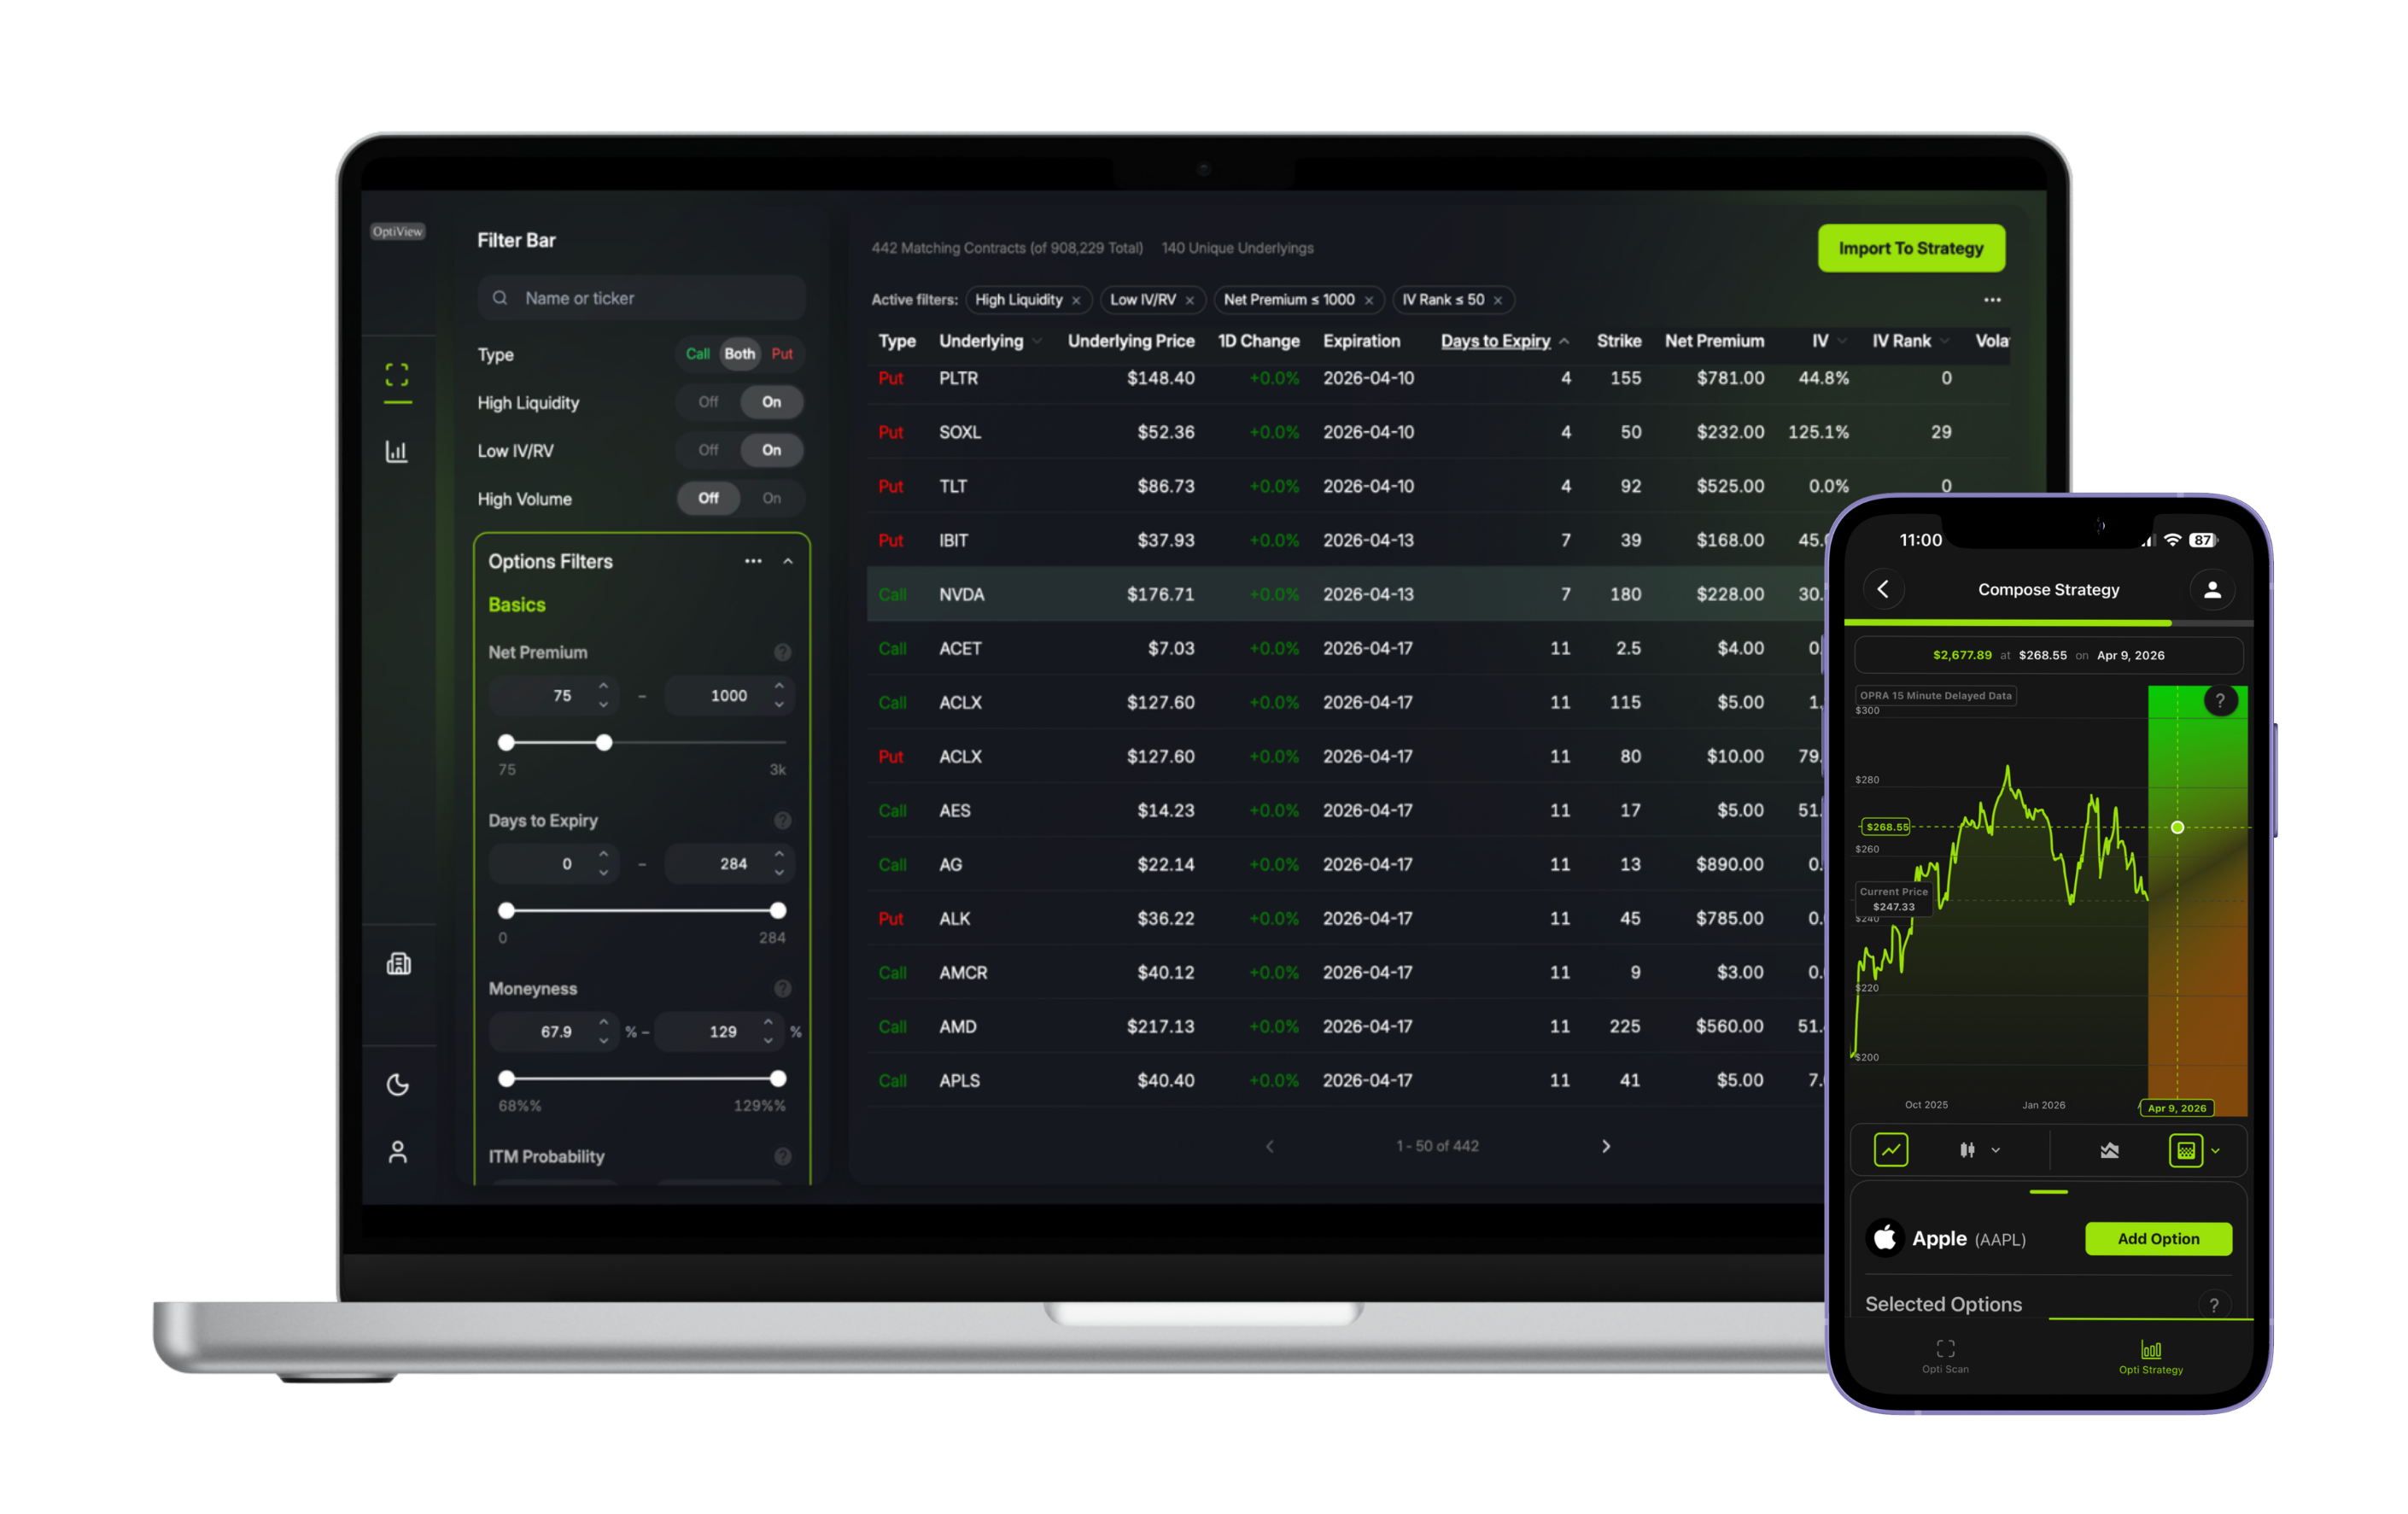
Find the right options at the right time with OptiView Desktop and Mobile apps
Integrated with major U.S. brokers
Connect your brokerage account to access live U.S. equity and options data and order execution capabilities. Alternatively, use OptiView’s free 15-minute delayed OPRA data feed, no broker connection needed.


What we offer
OptiView gives you advanced tools to find high-performance trades and stress-test your P&L with confidence.
Scan the universe
Filter the entire universe of U.S. listed options with OptiScan to surface high-potential trades instantly.
Payoff Visualization
Explore full P&L outcomes for single- and multi-leg strategies through expiration in our OptiView chart.
Free options data
Access a rich pool of historical, 15-minutes delayed and live* options data.
Optimize your strategy
Algorithmically find optimized alternatives that maximize efficiency and outcomes.
Stress-test positions
See how your strategy performs under different volatility regimes, dividend yields, and interest rates with our stress testing feature.
Gain access to trade insights
Join our network to keep up to date with global trends and receive the latest on trade insights, idea generation, strategies and more.
Keeping you safe
Online security is always a priority. We implement a range of controls to keep your data and account safe.
Brokerage authorization
Connect to your brokerage account using industry standard OAuth2.0. We never see your brokerage credentials or login details.
Data encryption
We keep your personal data from your OptiView account fully encrypted in transit and at rest.
Data confidentiality
We adhere to all relevant data rules including EU GDPR requirements. Find out more in our privacy policy.
Direct support
We provide direct and responsive support for any issues with your account at [email protected].

Payment
Take advantage of our free plan or upgrade to premium for access to even more advanced analytics
Free Plan
Access options data and OptiView’s core tools for free, no commitment required.
$0 / monthFree forever
- Free options data
- Option universe scanner
- Strategy builder
- Payoff visualization
- Strategy optimization
Premium Plan
Gain access to additional features and advanced analytical tools.
$20 / monthBilled $20/mo
- Deep Search strategy optimization*
- Trade discovery under asymmetric risk*
- Stress-testing panel*
- Full IV profile view*
- Unlimited strategy tabs

Frequently Asked Questions
Everything you need to know about OptiView and options analytics.
Explore the next-gen in options trading today
Available on desktop or you can download our app on the App Store or Google Play store.